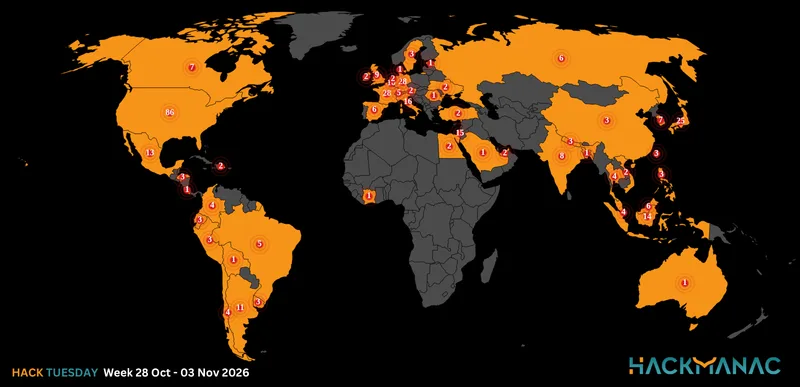
Week 28 October–03 November 2026
389 cyberattacks across 52 countries
Global avg ESIX© of the week: 4.74
Strategic cyber threat intelligence
Traditional threat intelligence tells you what attackers did. Hackmanac tells you how bad it was — and how bad the next one could be for an organization like yours. 65,000+ verified incidents. Analyzed, classified, scored, and ready to act on.
Our solutions
At Hackmanac, we build solutions for those who own the budget. We provide live visibility into real attacks and their severity trends, as well as the financial consequences of past attacks and the type and magnitude of future ones. We also offer bespoke consulting services for situations that a platform cannot solve alone.
Provides strategic threat intelligence on over 65,000 verified attacks, which are scored using the ESIX© Severity Index and segmented by industry, geography, attacker type, technique and threat actor.
The platform includes the threat feed, trend analysis tools, alerts and the Threat Impact Simulator.
Global cyber loss analytics: severity-scored incident data translated into quantified economic loss by area, country, industry, technique, and threat actor. It provides separate tracks for data breach and DDoS incidents, materiality by company size and the industry-impact matrix, as well as several other unique views on our loss data.
Discover HacklossIn addition to our strategic threat intelligence and loss analytics platforms, we provide custom cyber risk and potential loss reports, dark web monitoring, cyber strategy assessments and C-level training and awareness programmes. All of these services draw on the same unique data and over 20 years of expertise in the field.
See all servicesWhy Hackmanac
The same question keeps resurfacing in every CISO engagement: What is the true impact of this kind of attack on an organisation like ours? Where should we invest our resources? Vendor surveys can be biased, and synthetic models can be inaccurate. Traditional threat intelligence doesn't have these answers either.
Hackmanac was built to close this gap — with years of curated incident research, a proprietary severity index, and two dedicated platforms that put impact-based strategic intelligence in the hands of decision-makers. Transparent, auditable, up-to-date figures that you can bring to the Board.
Incident counts give you partial visibility. Severity, acceleration, and concentration reveal where your real exposure lives — and where defensive resources actually pay off.
Identical attack vectors produce vastly different outcomes across industries, company sizes, countries and threat actors. True resilience requires responses tailored to your sector, geography, and threat profile.
State-aligned actors and organized criminal groups now operate above the critical risk threshold. Mitigations must include impact containment, precise reserves allocation, and optimized risk transfer.
Our proprietary moat
In 2024, ESIX© made strategic threat intelligence quantifiable for the first time. In 2025, we extended the framework with two new lenses — designed to detect critical shifts before they escalate. In 2026, we introduced HackLoss and the new Relative Loss Intensity index.
A single 1–10 absolute severity score weighing operational, financial, technical, legal, and reputational consequences of an incident. The foundation of our impact-based threat intelligence.
Quantifies the rate of change in aggregate incident severity across sectors, geographies, and techniques — distinguishing accelerating threats from stabilizing ones.
A severity anomaly detection metric. QSI captures subtle transitions in threat levels — surfacing latent clusters before they manifest as widespread incidents.
A loss anomaly detection metric. RLI compares a group's share of total loss with its share of incident volume — showing how loss is concentrated and deviates from the average.
Threat Impact Simulator
Enter your industry, country and size. In a few seconds, the Threat Impact Simulator© inferential engine will return your most likely and worst-case attack scenarios, with their calibrated SLE (single loss expectation) ranges and their spread (heavy, typical, or mild). All estimates are based on tens of thousand of verified incident data from the last 60 months and are fully auditable.
Inside HackRisk.io
HackRisk offers constantly updated visibility into real-world attack patterns, severity-scored and segmented across every dimension that matters for situational awareness, risk management and decision-making.
Visualize attack distribution and severity across regions and countries, in real time.
Prioritize threats by real-world impact, not by volume or CVSS scores alone.
Slice by severity, industry, location, attacker class, technique, and 20+ additional variables.
Model your specific risk scenarios and evaluate potential losses in seconds.
Inside Hackloss.io
Hackloss turns ESIX©-scored incident data into economic loss figures: how much cyber incidents cost, by industry, region, country, company size, technique and threat actor, and how those losses evolve over time.
Estimated economic loss calibrated on verified, severity-scored incidents, not survey answers or abstract models.
Compare losses by industry, region, country, company size, attack technique and named threat actor.
Statistical spread, confidence level and data recency come with each estimate, so every number can be audited.
Download the Global Cyber Loss Report for free. Pro adds all twelve dashboard sections, and the API puts the data in your own systems.
Flagship research
The Global Cyber Attacks Report maps what attackers did. The Global Cyber Loss Report estimates what it cost.
The fifth annual report introduces three new proprietary insights (Impact Momentum, Quiet Shift Index and Impact-Exposure Matrix), derived from six years of curated incident analysis.
Estimated global loss, its distribution, loss by country and the monthly shocks, plus high-level highlights from the industry, technique and threat-actor analysis. Published twice a year.
Cited by leading outlets worldwide
Open research
Weekly attack tracking, expert long-reads, monthly threat reports and annual global reports. All built on the same dataset that powers HackRisk and HackLoss. All free to read, with new entries every week.
LONG-READS
Strategic analysis from our research team on emerging threats, attacker shifts, and the geopolitical forces shaping cyber risk.
Browse the latest articlesWEEKLY
Every confirmed cyber attack from the past seven days, mapped and classified by ESIX© severity.
Read this week's editionMONTHLY
Full analytical narrative on each month's threat landscape, with sector breakdowns and an executive summary.
Read the latest reportYEARLY
Strategic insights about incident severity and loss trends, grouped by industry, company size, geography, technique and attacker.
Read all global reports
389 cyberattacks across 52 countries
Global avg ESIX© of the week: 4.74
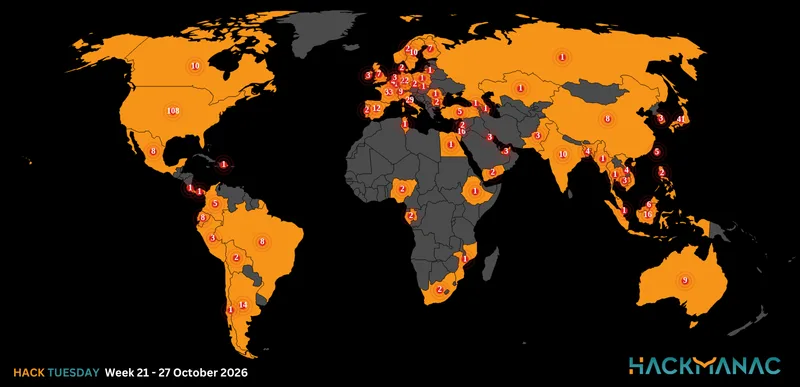
494 cyberattacks across 67 countries
Global avg ESIX© of the week: 4.80
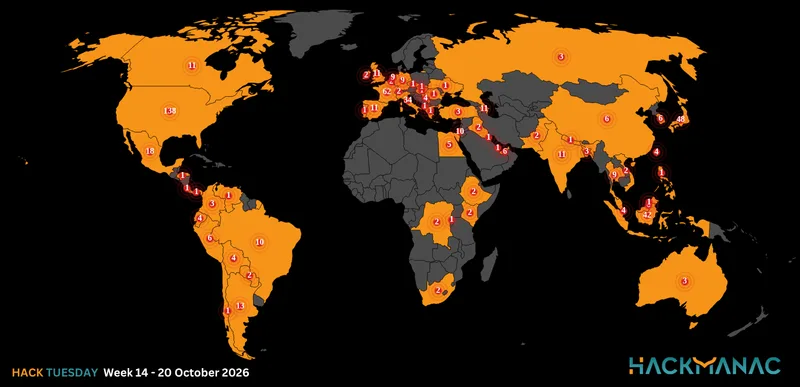
585 cyberattacks across 64 countries
Global avg ESIX© of the week: 4.55
From "how many attacks?" to "how much damage?"
The clarity needed for sharper strategy.