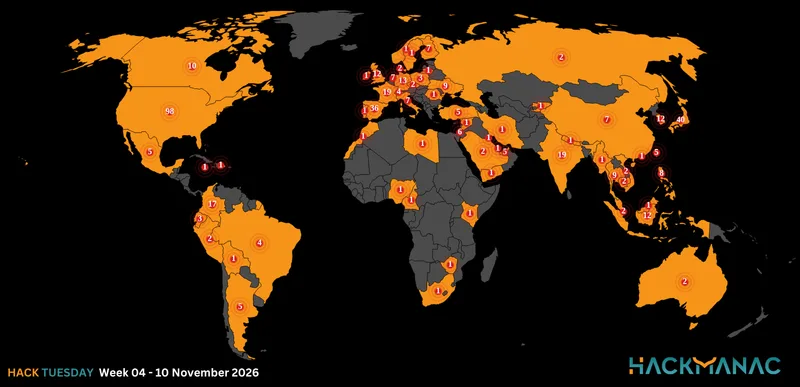
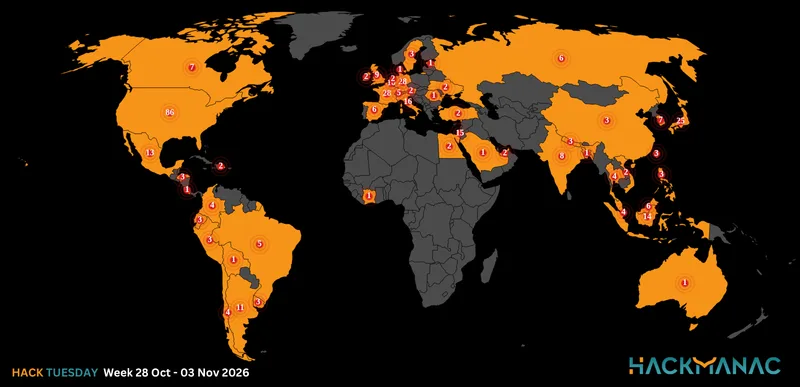
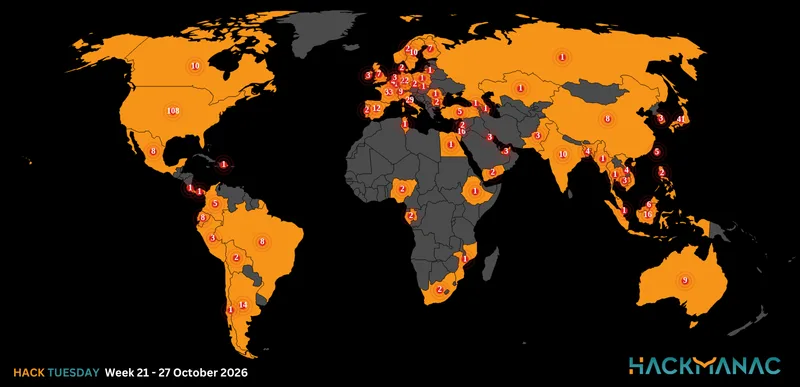
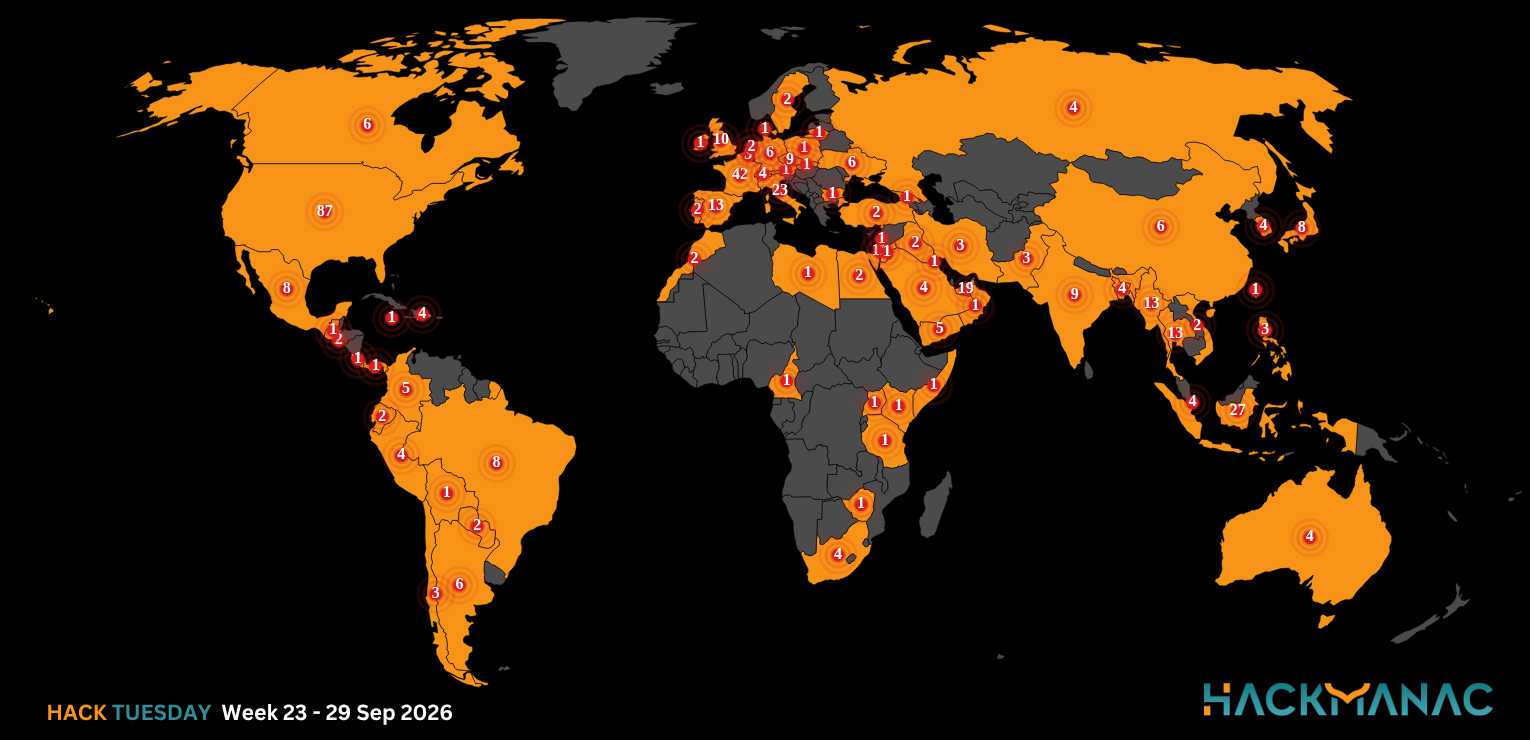
458 cyberattacks across 74 countries
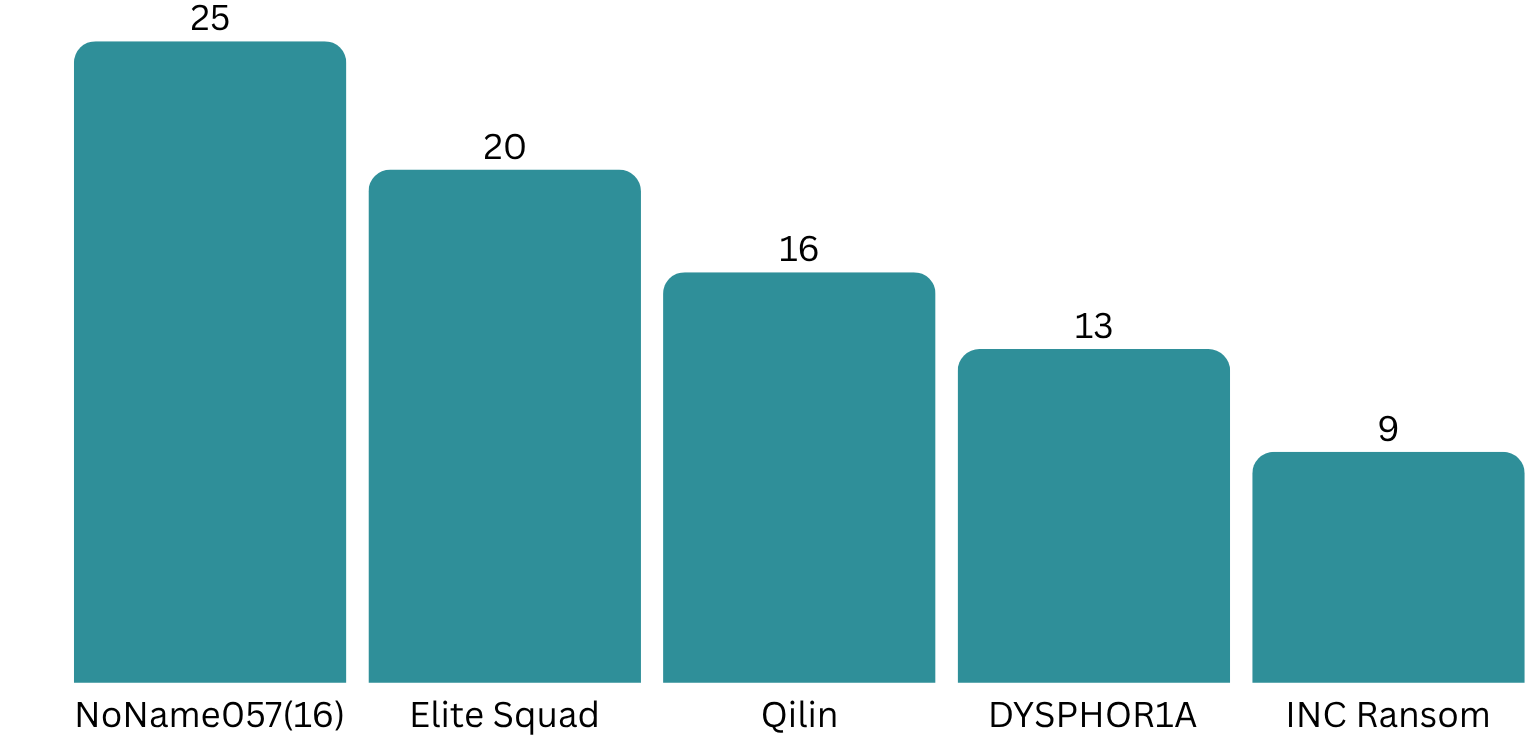
- The most active threat actor last week was NoName057(16) claiming responsibility for 25 cyberattacks.
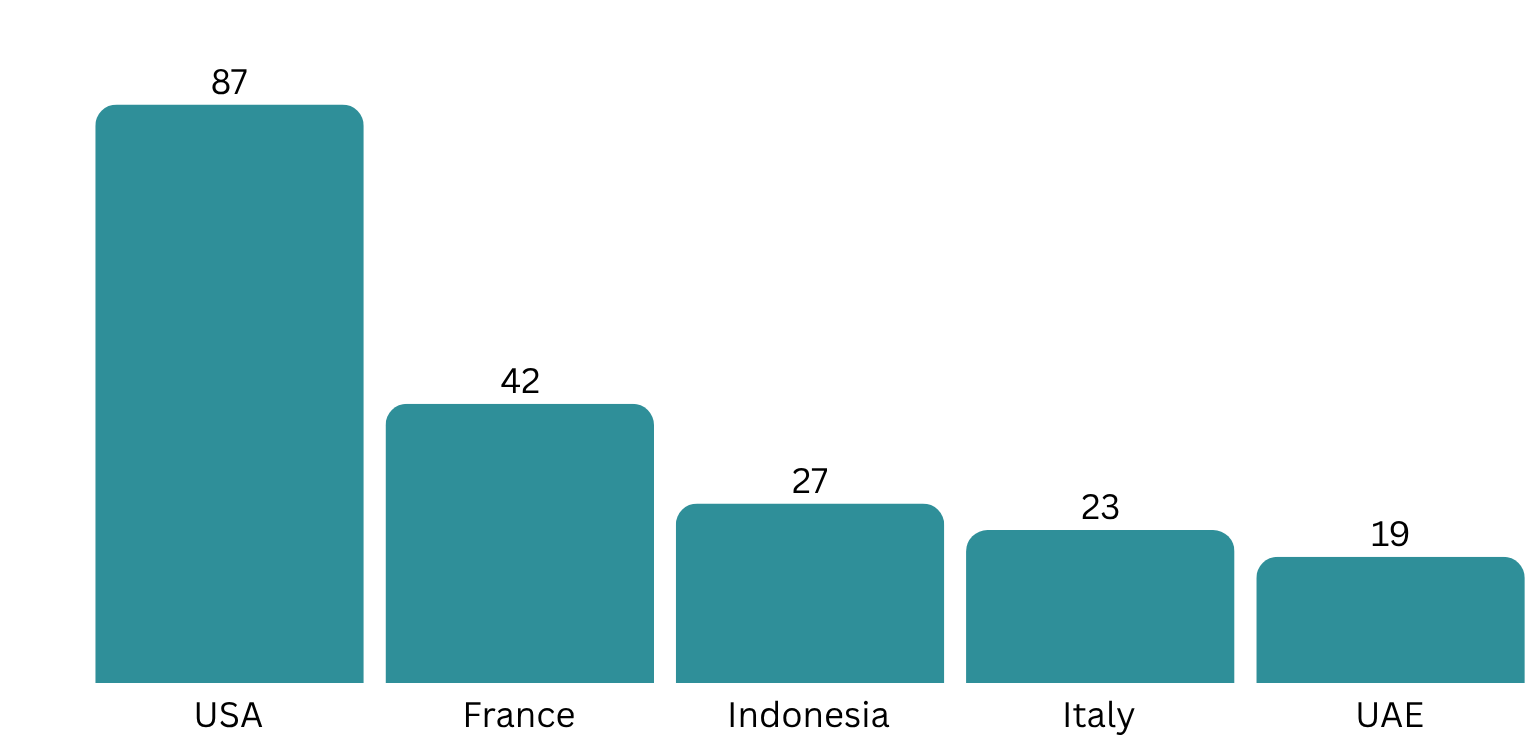
- The USA is the most affected country, accounting for 19% of incidents, with 87 cyber attacks.
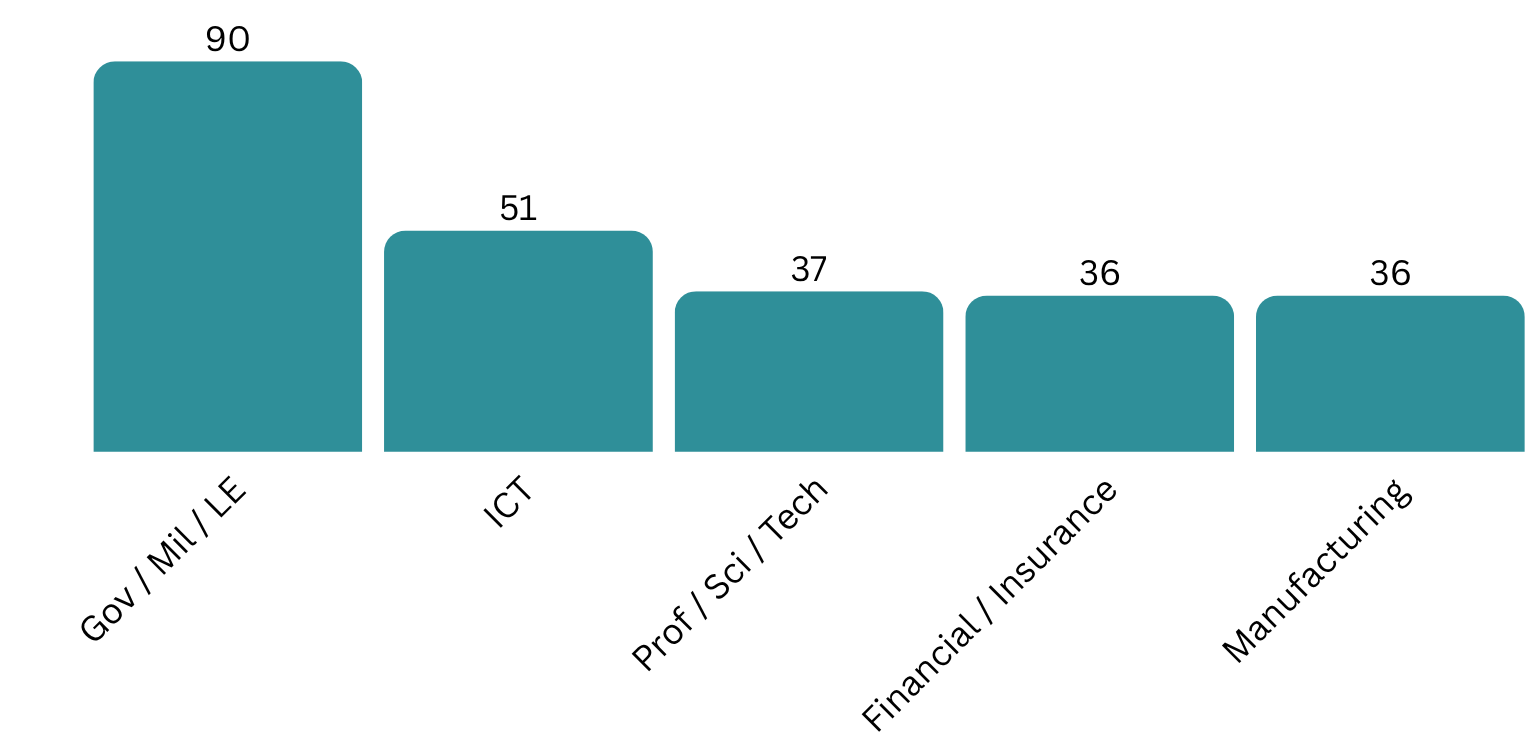
- The Gov / Mil / LE sector is the most targeted, accounting for 19.7% of incidents with 90 cyber attacks.
- The estimated Critical cyber attacks account to 66 (14.4% of the total).
- Overall, the claimed compromised data amounts to approximately 22.3 TB.
Top 5 cyber threat actors of the week
Top 5 targeted industries of the week
Top 5 targeted countries of the week
Top 5 impacted victims of the week
Global average ESIX© of the week: 4.60
| Country | Victim | ESIX© | Severity | Details |
|---|---|---|---|---|
 |
BitgetSeychelles | 7.96 | Extreme | View details → |
 |
Merrimack County GovernmentUnited States | 7.56 | Extreme | View details → |
 |
MA.P.S.P. San GaetanoItaly | 7.45 | Critical | View details → |
|
Salesforce Data.comUnited States | 7.19 | Critical | View details → |
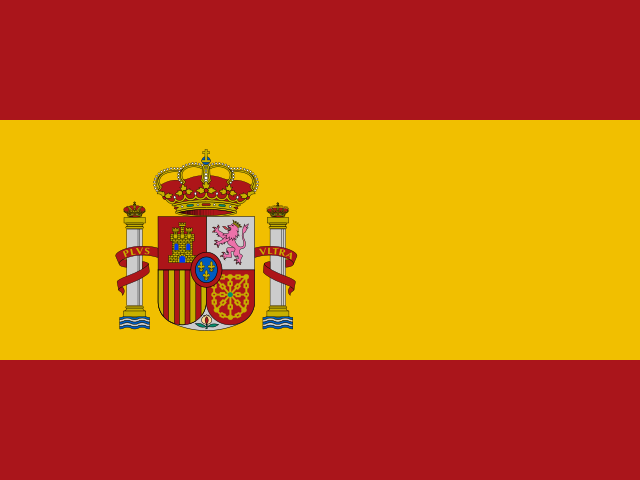 |
Adif and RenfeSpain | 6.89 | Critical | View details → |
Disclaimer:
Our database is compiled from publicly available information that has been hand-picked and retrieved from both the Clear Web and the Dark Web.
For every attack we classify and analyze, we calculate an Estimated Severity Index (ESIX©) on a scale of one to ten, corresponding to five impact categories, from low to extreme.
Data quality matters to us. If you notice any error or inconsistency, please let us know at data@hackmanac.com. We will investigate, review and, where needed, correct it.